Audio CaptionStartStop

Creating a Chart Using the Chart Wizard

To use the Chart Wizard:

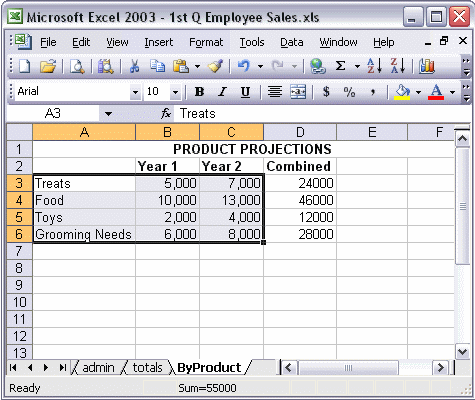
  1. Select the data you want to display in your chart.
  2. Click the Chart Wizard button on the Standard toolbar.
  3. On the first screen of the wizard, select the type of chart you want to insert. Click Next.
  4. In step 2, verify that the data range matches the data you selected, and select how you want the data series to appear. Click Next.
  5. In step 3, set options for your chart such as the chart title and whether or not you want a legend to appear. Click Next.
  6. In step 4, select whether you want the chart to appear on a new sheet or as an object in an existing sheet.
  7. Click Finish.

To open the Chart Wizard, click the Chart Wizard button on the Standard toolbar. On the first screen of the wizard, select the type of chart you want to insert. Click the Next and Previous buttons to navigate through the wizard and create your chart. When you are satisfied with your chart, click Finish.